Monday, May 29, 2023 – Offshore North Pacific Coast (Latitude: 43.02.679N; 124.33.120W)
Time to Cast for some Phytoplankton!
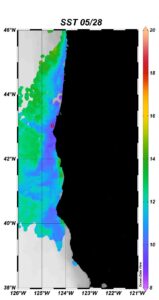
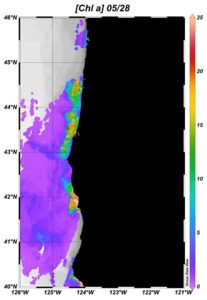
In addition to checking weather forecasts for predicted wind directions, the scientists also analyze satellite and buoy data to track changes in Sea Surface Temperature (SST) and Chlorophyll (CHLA). Cooler SST is a good indicator that an Upwelling Cycle is pushing cooler water toward the surface and elevated CHLA levels indicate that phytoplankton are in abundance and producing chlorophyll as they conduct photosynthesis. Enhancing the color of each satellite image provides a clear representation of levels of Chlorophyll and the Sea Surface Temperature. The Red Dot shown in Figure 5 indicates the region being investigated by PUPCYCLE II for the first water sample collection. The scale located along the right border of each image illustrates much cooler sea surface temperatures on May 28 and elevated levels of Chlorophyll-A. These two variables provide a point of destination for the first day of sampling.
Scientists use a CTD (Conductivity, Temperature, and Depth) Rosette to “ground truth,” or in this case “ocean truth,” and determine if the satellite images are correct in predicting an active upwelling site. The first CTD cast was completed before 5:30AM. (See Figure 7.) Based on the samples analyzed from the first cast, the researchers concluded that the satellite images were correct but the upwelling cycle had begun prior to our arrival. Our first samples appear to be the result of an upwelling event that began a few days ago. The research teams will continue to collect and analyze samples from this area as the ship follows the upwelling cycle. A few samples of the microscopic organisms captured today are shown in Figure 8 (below).
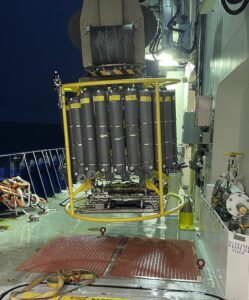
The CTD Rosette [Figure 7] measures Conductivity (for a salinity reading), Temperature, and Depth as the instrument is lowered into the ocean. The long grey bottles are locked OPEN until the CTD reaches the depth selected by each research team. A computer signal trips the top and bottom covers of the tubes to close and seal the seawater inside for the return to the ship and analysis.
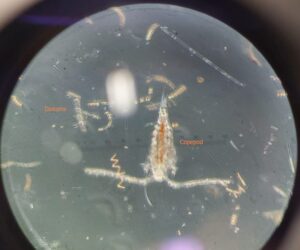
Figure 8 – A large Copepod is swimming amongst a sea of Diatoms. Copepods are Zooplankton and considered to be Consumers in the Aquatic Food Web. [Photo credit: Raquel Flynn, UCONN]