Virtual Research Cruise
Virtual Research Cruise – These activities take you on a 14-day expedition into the northeastern Pacific Ocean with scientists as they explore the responses of phytoplankton to coastal upwelling dynamics along the California Current. [PUPCYCLE is an acronym used throughout the 2-week cruise and stands for Phytoplankton response to the UPwelling conveyor belt CYCLE.] Daily Logs, videos, and activities were developed during PUPCYCLE I (aboard the R/V Oceanus, 2019) and PUPCYCLE II (aboard the R/V Sally Ride, 2023). In addition, Phytoplankton Responses During an Upwelling Cycle (published below) provides an extension activity to the Virtual Research Cruise activities.
(Credits: Miriam Sutton, Science by the Sea, developed these activities based on Teacher at Sea experiences aboard the R/V Oceanus and the R/V Sally while participating in “An Integrated molecular and physiological approach to examining the dynamics of upwelled phytoplankton in current and changing oceans.” (Award Abstract #OCE1751805) Research Project.)
Additional Resources for Virtual Research Cruise:
- Virtual Research Cruise Activity
- Virtual Research Cruise Syllabus – PUPCYCLE I (2019)
- PUPCYCLE Fact Sheet
- PUPCYCLE I Log
- PUPCYCLE I Video Log
- PUPCYCLE I Challenge Questions Chart
- PUPCYCLE I Quiz
- Virtual Research Cruise Syllabus – PUPCYCLE II – PUPCYCLE II (2023)
- PUPCYCLE II Challenge Questions
- PUPCYCLE II Daily Log
- PUPCYCLE II Video Log
- PUPCYCLE II Quiz
Phytoplankton Responses During an Upwelling Cycle
Phytoplankton Responses During an Upwelling Cycle – This lesson provides students with real scientific data collected during a 2-week research cruise aboard the R/V Sally Ride off the northwest coast of the US. Students will observe research techniques demonstrated by the scientists and generate graphs investigate the responses of microscopic organisms as they respond to an abundance of nutrients provided during an upwelling cycle. Primary productivity, biogeochemical cycles, and remote sensing technologies are also explored in this lesson. (Credits: Miriam Sutton, Science by the Sea, developed this activity based on a Teacher at Sea experience aboard the R/V Sally while participating in “An Integrated molecular and physiological approach to examining the dynamics of upwelled phytoplankton in current and changing oceans.” (Award Abstract #OCE1751805) Research Project.)
Additional Resources for Phytoplankton Responses During an Upwelling Cycle:
- PowerPoint Instructional Guide (PDF Version)) – Teacher Instruction PowerPoint and Lab KEY are also available upon request.
- Student Lab Sheet – Phytoplankton Responses During an Upwelling Cycle
Aquatic Food Web
Diatom Adventures – This activity can be used with introductory or review material for microbiology, ecosystems, or nutrition standards. Students complete the board game in teams of four as they discover the nutritional requirements needed by microbes (e.g. diatoms) for survival and reproduction. Trophic levels are also explored, in addition to predator/prey relationships occurring within the aquatic food web. (Credits: Miriam Sutton, Science by the Sea, developed this activity based on a Teacher at Sea experience aboard the R/V Melville while participating in “Collaborative Research: Investigating the Ecological Importance of Iron Storage in Diatoms” (Award Abstract #1334935) Research Project.)
Additional Resources for Diatom Adventures:
Depth and Pressure
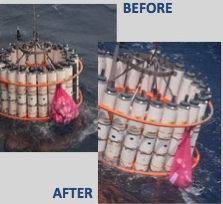
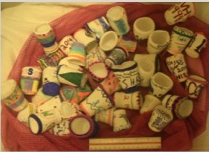
Art Meets Science in the Deep Blue Sea – This lesson allows students to merge Art with Science as they explore the affects of pressure with increasing ocean depths. Styrofoam cups are made using foam and air in a way that adequate insulation can be provided for hot or cold beverages. The air is forced out of the cups by the increase in pressure when the cups are secured to marine equipment (e.g., CTD) and lowered to depths exceeding 500 meters. It is recommended that this activity be completed during a unit that explores Earth’s ocean; including its unique ecosystems and species found in the deep sea. Art and Science educators may work collaboratively on this activity to insure that appropriate art and science standards are met. (Credits: This lesson was designed by Miriam Sutton, M.A., NBCT during a Teacher at Sea experience aboard the R/V Melville while participating in “Collaborative Research: Investigating the Ecological Importance of Iron Storage in Diatoms” (Award Abstract #1334935) Research Project.)
Additional Resources for “Art Meets Science in the Deep Blue Sea”:
- Lab Sheet – Styrofoam Cup Experiment (Answer Key available upon request.)
- Styrofoam Cup Images
Climate Science
The Ocean and Weather: El Niño and La Niña
(Students explore the weather phenomena El Niño and La Niña and their effects, map where they occur, and discuss the benefits of accurately predicting these phenomena. Credits: Naomi Friedman, M.A. Political Science, Christina Riska Simmons, Sarah Wilson, National Geographic Society. Source: Adapted from National Geographic Xpeditions lesson “The Ocean and Weather: El Niño and La Niña”.)
Coral Bleaching with GIS
In this activity, GIS (Global Information Systems) will be used to observe and evaluate coral bleaching collected worldwide. Coral bleaching will be defined and data from January through December in a 5-year period will be compared to determine the progression or decline of coral bleaching throughout the world’s coral reef system. Students should be familiar with the following terminology: global warming, seasonal climate variations, and coral reef systems.
Sea Level Trends
This lesson is designed as an introductory activity to an exploration in global climate change. Students will access real scientific data and follow the scientific method to investigate and compare long-term changes in sea level from different coastal locations around the United States.
Additional Sea Level Trends Resources: Understanding Sea Level Change
Remote Sensing/Tracking Oceanic Predators
Tag, You’re It!
This lesson provides a guideline for students to become Citizen Scientists as they explore relationships between migratory patterns in marine organisms with short and long-term changes in Sea Surface Temperature (SST). This lesson simulates a LTER (Long Term Ecological Research) study by allowing students to track shark migratory patterns over time using the OCEARCH Shark Tracker software and applications and NANOOS Visualization System (NVS) Climatology data sets. Students will compare OCEARCH’s satellite tracking data for pelagic apex predators (sharks) with NVS’s SST maps to observe for patterns and trends in migratory behavior. (Credits: Miriam Sutton, (Science by the Sea) and Carrie Lee (South Prairie Elementary) developed this activity during MBARI’s EARTH/Oregon Coast Regional STEM Education Center Mathematics and Science Partnership (MSP), Workshop in Newport, OR, 2015.)
Upwelling
Upwelling: Cold One Day, Warm Another?
(Using water temperature and wind vector data from the U.S. Army Corps of Engineers Field Research Facility, students explore trends in nearshore upwelling. . Published by VIMS, College of William and Mary, The BRIDGE.)
Polar Science
Antarctic Convergence Lab Activity
This activity developed during a 2-week expedition to the West Antarctic Peninsula with through National Geographic/Lindblad Expedition’s Grosvenor Teacher Fellowship. Students access data using xCel to analyze changes in Sea Surface Temperature along the Antarctic Convergence Zone.
Additional resources for Antarctic Convergence:
Ocean Chemistry
Lab – Exploring Ocean Chemistry
This lab activity allows students to explore the unique physical and chemical properties of water relative to our ocean.
Adopt-a-Float
Adopt-a-Float Starter Lesson
This activity introduces students to the Global Ocean Biogeochemistry Array of floats being used to gain an understanding of the various ocean chemistry variables and monitor the ocean’s health and productivity.
Learn how your school can adopt a float here: https://www.mbari.org/project/go-bgc/ (Video (@2.30 minutes) explains GO-BGC program and how the profile floats work.